Microsoft Excel is a powerful spreadsheet software that is widely used for data analysis, calculations, and reporting. While most users are familiar with the basic features of Excel, there are several advanced tools that can greatly enhance your productivity and make complex tasks easier. In this article, we will explore 10 Microsoft Excel tools that you might not be aware of but can significantly improve your experience with the software.
Tool 1: PivotTable
PivotTable is a dynamic table that allows you to summarize and analyze large amounts of data. It enables you to rearrange, filter, and group data to extract valuable insights. With PivotTable, you can easily create interactive reports, perform data comparisons, and identify trends and patterns.

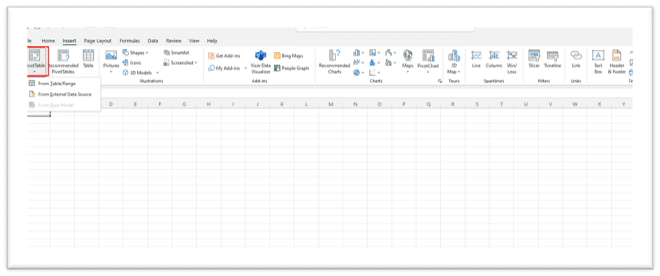
To create a PivotTable, select your data range, go to the “Insert” tab, and click on “PivotTable.” Choose the fields you want to include and customize the layout and calculations according to your requirements. PivotTable is an invaluable tool for data analysis and reporting.
Tool 2: Data Validation
Data Validation is a feature that allows you to define rules and restrictions for the data entered in a cell. It helps maintain data integrity and accuracy by preventing users from entering invalid or inappropriate data. With data validation, you can set criteria such as numerical ranges, date limits, or dropdown lists, ensuring that only valid data is entered.

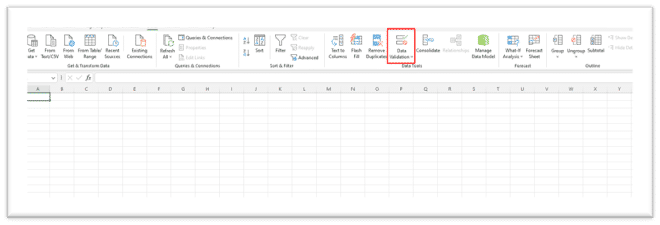
To apply data validation, select the cell or range where you want to enforce the rule, go to the “Data” tab, and click on “Data Validation.” Choose the type of validation you want to apply and define the specific criteria. Data validation is a handy tool for controlling data input and maintaining consistency.
Tool 3: Conditional Formatting
Conditional Formatting allows you to highlight specific cells or ranges based on predefined conditions. It helps visualize data patterns, identify outliers, and draw attention to important information. With conditional formatting, you can apply various formatting styles, such as color scales, data bars, and icon sets, to make your data more visually appealing and informative.

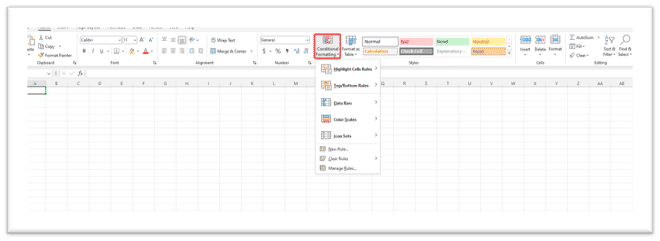
To apply conditional formatting, select the cells or range you want to format, go to the “Home” tab, and click on “Conditional Formatting.” Choose the formatting rule you want to apply and customize the formatting options. Conditional formatting is a powerful tool for data visualization and analysis.
Tool 4: Goal Seek
Goal Seek is a tool that allows you to find the input value needed to achieve a specific result. It is particularly useful when you have a target value in mind and want to determine the corresponding input that would yield that result. With goal seek, you can perform reverse calculations and quickly find the required input value.

To use goal seek, go to the “Data” tab, click on “What-If Analysis,” and select “Goal Seek.” Specify the cell that contains the formula you want to achieve, set the target value, and select the cell that represents the input you want to adjust. Goal seek will calculate the necessary input value to meet the target.
Tool 5: Solver
Solver is an optimization tool that helps you find the optimal solution for complex problems with multiple variables and constraints. It can be used for various tasks, such as resource allocation, production planning, and financial modeling. Solver analyzes different scenarios and adjusts the variables to achieve the best possible outcome.

To access Solver, go to the “Data” tab, click on “What-If Analysis,” and select “Solver.” Define the objective function, set the constraints, and specify the adjustable cells. Solver will perform calculations to determine the optimal values for the variables
Tool 6: Power Query
Power Query is a data transformation and cleansing tool that allows you to import, combine, and refine data from different sources. It provides a user-friendly interface for data preparation tasks, such as merging tables, removing duplicates, filtering, and splitting columns. Power Query can save you a significant amount of time and effort when dealing with complex data sets.

To use Power Query, go to the “Data” tab, click on “Get Data,” and select the desired data source. Follow the prompts to transform and clean the data according to your requirements. Power Query offers a wide range of data manipulation options and supports connections to various data formats and databases.
Tool 7: Flash Fill
Flash Fill is a time-saving tool that automatically extracts and formats data based on patterns it detects. It can be used to split, combine, or format data without the need for complex formulas or manual editing. Flash Fill is particularly useful when working with names, addresses, or other structured data.

To use Flash Fill, start typing the desired pattern in a column adjacent to the data you want to modify. Excel will detect the pattern and automatically apply the same transformation to the rest of the column. Flash Fill is a handy tool for quickly manipulating data and improving data consistency.
Tool 8: Sparklines
Sparklines are miniature charts that provide a visual representation of data trends within a single cell. They allow you to display trends, variations, and patterns without taking up much space. Sparklines are particularly useful when you want to provide a quick overview of data within a small area.

To insert Sparklines, select the cell where you want to display the Sparkline, go to the “Insert” tab, and click on “Sparklines.” Choose the type of Sparkline you want to create, select the data range, and customize the appearance. Sparklines can be a powerful tool for visualizing data within a compact space.
Tool 9: Transpose
Transpose is a feature that allows you to change the orientation of data from rows to columns or vice versa. It is useful when you want to rearrange data or perform calculations in a different layout. Transpose can save you time and effort by avoiding manual copying and pasting of data.

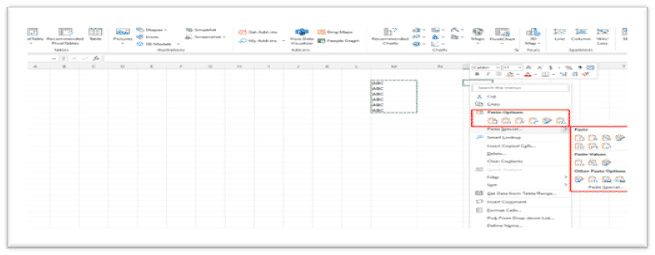
To transpose data, select the range you want to transpose, right-click, and choose “Copy.” Then, select the destination range, right-click, and choose “Paste Special.” In the “Paste Special” dialog box, check the “Transpose” option and click “OK.” The data will be transposed to the new location.
Tool 10: AutoSum
AutoSum is a quick and convenient tool for performing common calculations, such as sum, average, count, and more. It allows you to instantly calculate totals or other statistics without the need for complex formulas. AutoSum can significantly speed up your calculations and improve efficiency.

To use AutoSum, select the cell where you want to display the result, go to the “Home” tab, and click on the “AutoSum” button. Excel will automatically detect the range of data to include and display the appropriate calculation. AutoSum is a handy tool for basic calculations and aggregations.
Conclusion
In conclusion, Microsoft Excel offers a wide range of powerful tools that can enhance your productivity and simplify complex tasks. By exploring and utilizing tools like PivotTable, Data Validation, Conditional Formatting, Goal Seek, Solver, Power Query, Flash Fill, Sparklines, Transpose, and AutoSum, you can take full advantage of Excel’s capabilities and make your data analysis and reporting more efficient.
Remember to constantly explore and experiment with these tools to discover new ways to leverage Excel’s functionality. By mastering these tools, you can become a more proficient Excel user and unlock the full potential of this versatile software. You can also buy Windows 10 retail pro software from Indigo Software at affordable prices.
FAQs
How can I access these tools in Microsoft Excel?
To access these tools in Microsoft Excel, you can find most of them in the various tabs of the Excel ribbon. For example, PivotTable, Data Validation, and Conditional Formatting can be found in the “Insert” and “Data” tabs. Goal Seek and Solver can be accessed through the “Data” tab. Power Query is available in the “Data” tab as well, while Flash Fill, Sparklines, Transpose, and AutoSum are located in the “Home” tab.
Can I use these tools in older versions of Excel?
The availability of these tools may vary depending on the version of Excel you are using. Some older versions of Excel may not have all the advanced tools mentioned in this article. However, many of these tools have been introduced in earlier versions and have become standard features in recent versions of Excel. It is recommended to check the specific version of Excel you are using to determine the availability of these tools.
Are there any other useful tools in Excel?
Yes, Microsoft Excel offers a wide range of other useful tools that can further enhance your experience and productivity. Some additional tools include VLOOKUP and HLOOKUP for data lookup, CONCATENATE for combining text, IF function for conditional calculations, and many more. Exploring Excel’s functions and formulas can uncover a wealth of powerful tools to simplify your work and improve efficiency.
Can these tools help improve my productivity?
Absolutely! These Excel tools are designed to make complex tasks easier, save time, and improve productivity. By leveraging these tools effectively, you can automate repetitive tasks, gain valuable insights from data, and streamline your workflow. Learning and mastering these tools will undoubtedly enhance your productivity when working with Excel.
Where can I find more resources to learn about Excel tools?
There are numerous online resources available to learn more about Excel tools. You can refer to Microsoft’s official Excel documentation, watch video tutorials on platforms like YouTube, or enroll in online courses specifically focused on Excel. Additionally, there are Excel forums and communities where you can ask questions and learn from other Excel users’ experiences. Take advantage of these resources to expand your knowledge and skills in using Excel tools.

