introduction
Are you looking to elevate your data analysis skills in Excel? Pivot tables are an incredibly powerful tool that can help you transform raw data into meaningful insights with just a few clicks. In this comprehensive guide, we’ll walk you through everything you need to know to master Excel pivot tables and become a data analysis pro.
What are Pivot Tables?
Let’s start with the basics. Pivot tables are a feature in Microsoft Excel that allow you to summarize and analyze large datasets quickly and easily. With pivot tables, you can rearrange and summarize data to create interactive reports and dynamic visualizations without the need for complex formulas or manual calculations.
Getting Started with Pivot Tables
To create a pivot table, simply select your dataset and navigate to the “Insert” tab in Excel. From there, click on “PivotTable” and choose the range of data you want to analyze. Excel will then create a blank pivot table for you to work with.
Organizing Your Data
Once you’ve created your pivot table, the next step is to organize your data. You can drag and drop fields from your dataset into the “Rows,” “Columns,” and “Values” areas of the pivot table to arrange your data in a way that makes sense for your analysis.
Performing Calculations
One of the most powerful features of pivot tables is the ability to perform calculations on your data without writing complex formulas. With just a few clicks, you can calculate sums, averages, counts, and more, giving you deeper insights into your dataset.
Filtering and Sorting
Pivot tables also allow you to filter and sort your data dynamically, making it easy to focus on the information that’s most relevant to your analysis. You can apply filters to individual fields or use slicers to create interactive dashboards that update in real-time as you make changes.
Creating Visualizations
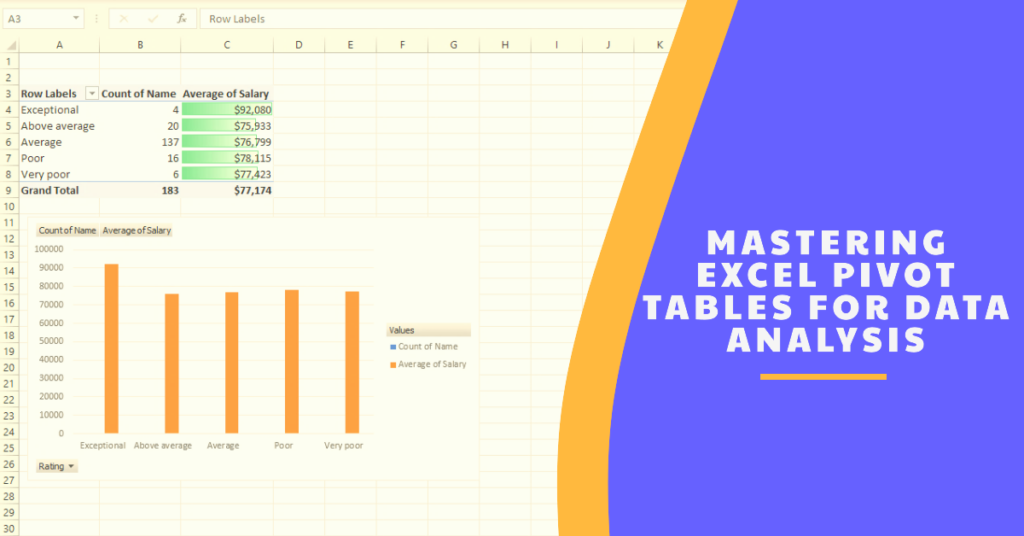
In addition to summarizing your data in tables, pivot tables also allow you to create dynamic visualizations such as charts and graphs. With just a few clicks, you can transform your raw data into compelling visuals that make it easy to communicate your findings to others.
Advanced Techniques
Once you’ve mastered the basics of pivot tables, there are many advanced techniques you can explore to take your data analysis skills to the next level. These include using calculated fields and items, creating custom layouts, and connecting multiple pivot tables to create complex reports.
Conclusion
In conclusion, mastering Excel pivot tables is a valuable skill that can help you unlock the full potential of your data. By organizing, summarizing, and visualizing your data with pivot tables, you can gain deeper insights, make better decisions, and ultimately drive success in your business or organization.
So why wait? Start exploring pivot tables in Excel today and take your data analysis skills to new heights!

